
Programming in Any Language
Formula 1 Speed Calculator
The Formula 1 Average Speed Calculator is really two applications. When the program comes up you see a “Race Results” screen. This is meant for viewing data you have stored out on disk. If you click the Data Entry screen the program totally switches to a data entry application where you can key in all the race data for a given race.
Click for larger view
This is accomplished by using panels. One panel contains all the data entry objects, the other contains all the display objects. You are creating two applications within a single form.

Click for larger view
Analysis: This may look complicated. But it is just a collection of simpler things. And we, as problems solvers, can analyze what needs to be done and prepare our application for assembly. Using a hierarchy chart, we can do the analysis on just what needs to be done to make this application a reality. Hierarchy PDF
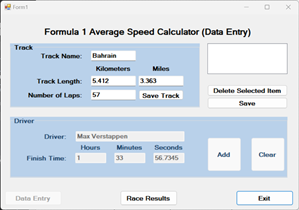
Data Entry Screen: This project is really two applications. One is entering all the data for the races. The other is displaying the race data on command. We want these two pieces not to interfere with one another. To do that we are going to use group boxes and panels. This will help with the logic of our program when we begin to code.
Panel Setup: Data Entry is pretty much taking up all the real estate at this time. Well, we need to think like an architect in downtown Manhattan and build up. Build layers. We do that by using panels. One on top of the other. But we only make one panel active at a time. It’s like going from the first floor to the second floor.
Coding Track Info: Coding track information is straightforward, but it does require us to make sure that the data we are receiving is good data. We validate the information. Once we’ve entered track information and have all that data safely stored in a series of variables, we can program our save button. Driver and Track PDF

Click for larger view

Click for larger view
Coding Driver Info: This is different than track info because for each track we have a number of drivers in each race. So, we need to collect the information for each driver.
The best way to do that is to use the list box. (Add to list box flowchart PDF) That way we can calculate the MPH and the KPH for each driver and save that info with the name to the list box. When we are done entering all the driver info we will be in a position to save all the info to disk. Driver and Track PDF
Saving the Data: We need to program the “Delete Selected Item” button first. After that we can write the routine to save the data. This means that we will save track information followed by the driver information. And since there are multiple drivers, we’ll need to employ a loop to save that data. Flowchart and Data PDF
Testing: The Data Entry screen is complete. We need to make sure the Data Entry screen is working smoothly and that nothing’s been missed. It is important to check this portion of the application because we want to code the Display Screen portion knowing that everything we are going to display is good data.
Display Screen: Now we can design the Display Screen. This is fairly short. We just need to place some labels and list boxes on the form and add two buttons.
Coding Race Results: Race Results is easy. You are just reading the data in the same order that you wrote the data earlier. You read the track information and then use a loop to read in all the drivers and their average speeds. Flowchart and Data PDF
Worst Case Testing: This is where you put extreme values in your program to see if it will fail. We can do that with our numeric entries, and this video will show you how. For string values like the track name and Driver name it’s not quite so easy - at this time. We haven’t learned enough.